Data Set/Source
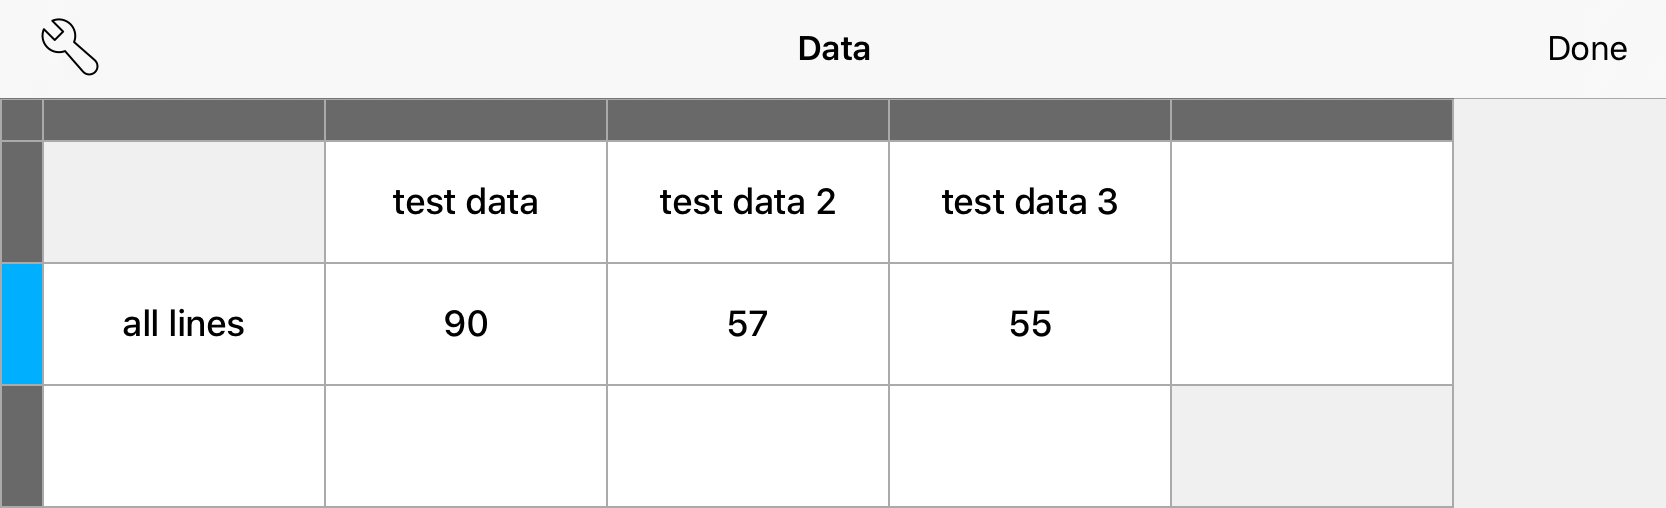
This table shows you the data set of the current chart.
Set
You can add a data set to your chart by selecting a white cell in the last row of the table, this opens the keyboard or add a cursor. To change the color or use cut, copy and past for a given data set, make a tab on the first cell.
Data
You can add additional data to a set be selecting a cell in the last column of the table, this opens the keyboard or add a cursor to the cell. The first cell (under the dark gray area) of the column is for setting the name of the data, all other field in the row are for values. To change the color or use cut, copy and past for a given data set, make a tab on the first cell.
Color by Set or by Data
To change the color by set or data (row or column), use the wrench icon, to open the context menu.